

“How to Make Money in Commodities”, published in 1960, is when grain trader Chester Keltner first unveiled his volatility indicator known as Keltner Channels.
Later, in the 1980s, Linda Raschke developed an improved version. The Keltner Channel, popularized by Linda, consists of three lines, somewhat dissimilar to Bollinger Bands.
Three lines make up the Keltner Channel’s default configuration now:
* Middle Line: 20-period Exponential Moving Average (EMA)
* Upper Channel Line: 20 EMA + (2 * Average True Range)
* Lower Channel Line: 20 EMA – (2 * Average True Range)
The Middle Line represents the average value. The Upper and Lower Channel lines also show distance from the middle.
Keltner Channels are similar to traditional histograms, except that the centerline is the Exponential Moving Average (EMA), and the peripheral lines are calculated with the Average True Range (ATR) in place of standard deviations known as SD.
Distinction Between the Keltner Channel and Bollinger Bands
Bollinger’s studies rely on standard deviation, while Keltner’s use high and low prices to represent volatility. Nevertheless, the two studies provide similar interpretations and signals for trading currencies.
Entry and exit points may be calculated using the Keltner Channel strategy for trading.
Especially in a trendless market, the Keltner Channel may be used to pinpoint when security is overbought or oversold about a moving average.
Furthermore, it may help us forecast the direction of future fashions. It’s similar to an up or down trend channel, except it adapts to price swings in real-time and uses curved lines instead of straight ones.
You may certainly infer that Keltner Channels are similar to Bollinger Bands. Almost, anyhow.
We could go into great detail on the underlying signs and mathematics that separate the two, but it could put you to sleep.
So, let’s say that the formulae provide indications with varying degrees of smoothness and price sensitivity.
Use Methods in Keltner Channels
A trader’s parameters will determine how they take advantage of Keltner Channels and their many applications.
With a longer EMA, the indicator will lag behind price fluctuations, and the channels’ reactivity will be slower.
When the EMA is small, the bands move fast in response to price fluctuations, but it becomes more difficult to determine the direction of the underlying trend.
Increasing the ATR multiplier used to generate the channel’s bands may increase the channel’s width. Less frequent price contact with the bands is expected. If the multiplier is reduced, the bands will be narrower, and the price will more often hit or surpass the bands.
Keltner Channels may be configured in any manner that suits the needs of the trader; however, the following are some common ones:
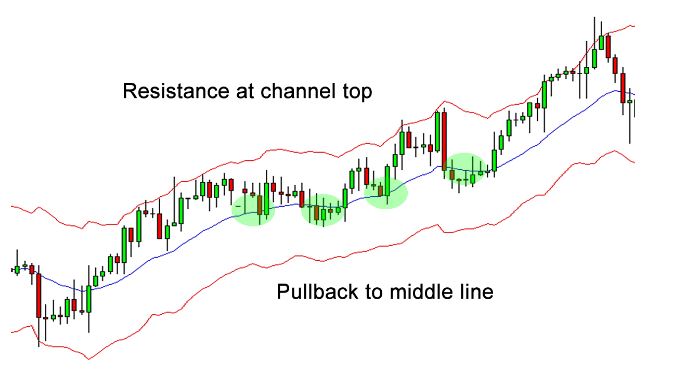
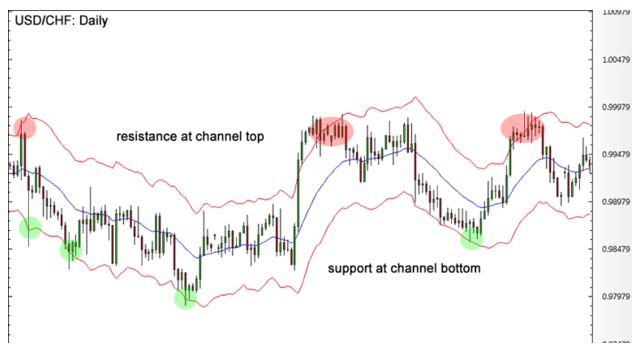
* The direction of a trend may be deduced from the channel’s orientation. If the channel is going up, it signifies prices are going up, and if it’s going down or staying put, prices are going down or staying put.
* As the price rises above the top band, buyers are becoming more confident in the direction of the price. If the channel is slanted upward, this is more evidence of a rising trend.
* When prices fall below the bottom band, they lose momentum. If the channel’s slope is also downward, prices are now falling.
* When the price eventually reaches the lower band after repeatedly hitting the upper band, it may indicate that the uptrend is losing steam.
* The higher band may indicate that the downtrend is about to terminate when it reaches the upper band.
* The price may bounce around between those two levels as well. The bands may act as a support and resistance for traders in these types of situations. When the price drops below the lower band and begins to rise again, they may decide to purchase, and when the price rises to the upper band and begins to fall again, they may decide to sell or go short.
* If the price breaks out above or below the channel after a period of consolidation, and the channel follows suit by sloping in the same direction, this might indicate the beginning of a new trend.
Constraints Associated with the Keltner Channel
Keltner Channels’ effectiveness is very context-dependent. To begin using the indicator effectively, traders must first determine their goals.
The aforementioned applications of Keltner Channels are limited by bandwidth and band spacing, respectively.
The ideal way to utilize Keltner Channels is in combination with price action analysis, fundamentals (if long-term trading), and other technical indicators to determine the direction of a trend and generate trading signals.
Additionally, the bands may not function as support or resistance and may have little predictive power.
Even if the price does move two ATRs or hits one of the bands, there is no guarantee that this will provide a trading opportunity or signal a big event.