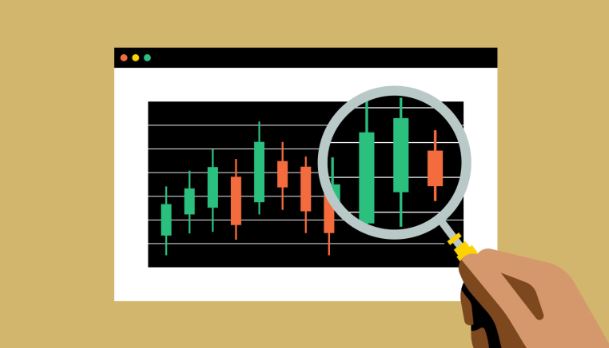
By understanding how open interest influences bullish and bearish signals and its correlation with market volume, you’ll gain a powerful tool to navigate the financial markets.
Dive in to unlock the secrets of open interest and elevate your trading strategy.
Learn how open interest is utilized in trader training through Quantum FBC, a firm dedicated to linking traders with seasoned educational professionals.
Open Interest as a Market Sentiment Indicator
Open interest is a handy tool for traders trying to gauge market sentiment. Imagine it as a tally of all open contracts in futures and options markets. When there’s an increase, it often means more traders are entering positions, which can signal rising interest in that particular market.
Conversely, a decrease might suggest that traders are closing out positions, potentially indicating waning interest. Think of it like a crowded room – the more people coming in, the more buzz and anticipation, whereas people leaving means the excitement is dwindling.
For instance, if open interest rises while prices climb, it can signal strong bullish sentiment. Traders are confident that prices will continue to go up.
On the other hand, if open interest falls as prices rise, it might mean that the rally is running out of steam, and traders are taking profits, not expecting prices to climb much higher. This nuanced interpretation helps traders make more informed decisions.
Why not test this out? The next time you’re monitoring a market, look at how open interest changes with price movements. Do they align with the crowd’s sentiment? This practice could give you an edge in understanding market dynamics and improving your trading strategy.
Interpreting Open Interest for Bullish and Bearish Signals
Interpreting open interest effectively can be the difference between making a smart trade and missing the mark. Think of it as reading the room at a party. If people are animated and engaging, the mood is upbeat (bullish).
If folks are leaving early, the vibe is off (bearish).
When open interest increases alongside rising prices, it’s usually a bullish signal.
It suggests more traders are opening long positions, betting that prices will continue to climb. Conversely, if open interest increases while prices fall, it’s typically a bearish sign. Traders might be entering short positions, anticipating further declines.
However, not all movements are straightforward. Sometimes, prices might rise while open interest falls.
This scenario often means traders are closing out positions and taking profits, hinting that the rally might be losing strength. Similarly, a price drop with falling open interest suggests short sellers are closing positions, which could signal a bottoming market.
Consider this: during a recent market surge in tech stocks, you notice open interest rising significantly. This rise suggests traders are piling into long positions, confident the rally will persist.
But if open interest starts dropping while prices are still high, it might be time to reassess – traders might be cashing out, expecting a pullback.
Correlation Between Open Interest and Market Volume
The interplay between open interest and market volume is a key factor for traders. Volume measures the number of contracts traded in a given period, while open interest shows the total number of outstanding contracts. Together, they paint a vivid picture of market activity and sentiment.
Imagine a scenario where both volume and open interest are rising. This situation indicates that new money is flowing into the market, with traders eager to open positions. It’s like a snowball gaining momentum as it rolls down a hill – the bigger it gets, the faster it goes.
This can be a bullish sign, suggesting strong market confidence.
Conversely, if volume increases but open interest decreases, it signals that traders are closing out existing positions.
This pattern might indicate uncertainty or a potential reversal. If both volume and open interest drop, it could suggest a lack of interest or a consolidation phase, where traders are waiting for clearer signals before committing.
To illustrate, let’s say you’re tracking the oil market. You notice a spike in trading volume and a corresponding rise in open interest. This pattern suggests that traders are betting heavily on future price movements, likely indicating strong market conviction.
However, if you see volume spike but open interest decline, traders might be closing out positions due to anticipated volatility or changing market conditions.
Conclusion
Mastering open interest can transform your trading strategy.
It’s a valuable indicator of market sentiment and trends. By leveraging this metric, you’ll be better equipped to make informed decisions, anticipate market movements, and improve your trading success.
Keep exploring, stay curious, and always seek insights from experienced traders and financial experts. Happy trading!


